Equity and bond markets around the world in 2019 enjoyed excellent gains. For the year:
- US stocks rose 31.5%.
- Global stocks gained 26.3%.
- Foreign stocks returned 22.0%.
- Emerging market stocks advanced 18.4%.
- Investment grade bonds gained 8.7%.
- Inflation rose to a 2.4% rate
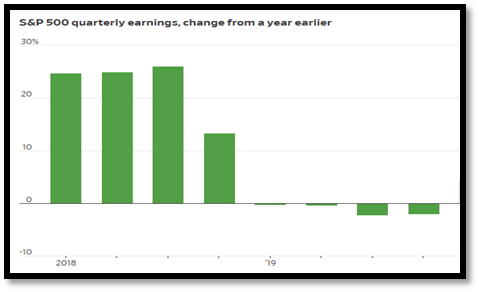
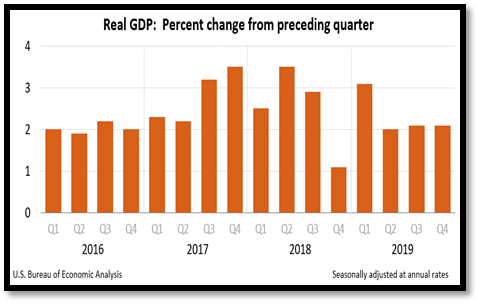
The economy and the markets seemed again out of sync in 2019. The stock and bond markets had an unusually good year and job gains drove the unemployment rate to a 50-year low of 3.5% – and yet economic growth was a mediocre 2.3% for the year (see chart)and corporate profits showed no growth at all for the year (see chart). Throughout the year,perceived economic weakness, and the threat of trade wars, induced the Fed to reverse course and lower interest rates.
With large cap companies paying dividends of 1.8% last year, 29.7% of the total gain of 31.5% was just new investors paying 29.7% more for the same dividend dollar than it cost a year ago! The best explanations for the disparity involve interest rates and “animal spirits”. Interest rate declines, and the expectation of them in light of President Trump’s messaging, lead market participants to move dollars from fixed income to equities and made fixed income prices rise. President Trump’s ability to create market enthusiasm around his policies, what economist John Maynard Keynes termed “animal spirits”, seems to continue to move markets in his desired direction as it has moved politics.The Fed cut its benchmark rate three times between July and October in 2019, to a range between 1.5% and 1.75%. Fed officials have held the rate steady now through January 2020 and indicate no urgency to reverse those cuts. At the start of 2020, it seems that recession concerns had lessened following US and global central banks engaging during 2019 in additional monetary easing, a partial trade truce between the US and China, and finally the start to implementing Brexit.
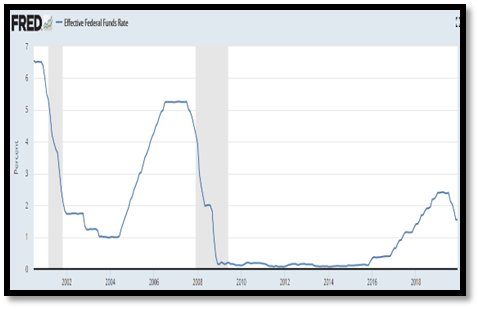
That said, eventually the next recession will arrive and serious questions exist concerning how the Fed will respond now that is has much less capacity to help the economy through reductions of interest rates. To deal with the latest two recessions, the Fed cut interest rates 5% each time to provide stimulus via cheap money (see chart). 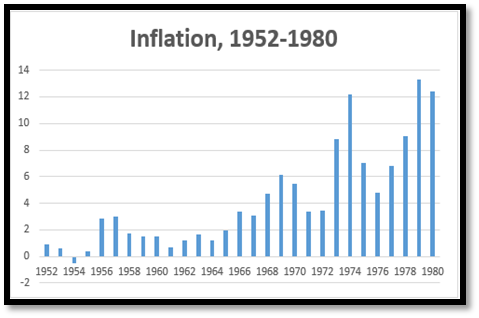 But today the Fed can cut only 1.5% before hitting zero, the notorious “zero lower bound” which confounds economists. Not being able to cut another 3.5% means that the Fed’s preferred tool is very limited and that it would then be forced to utilize less desirable innovative tools, such as during the Great Financial Crisis. Starting in late 2015, the Fed engaged in an effort to gain that “monetary space” by moving rates back up to previous norms. However, that effort upward was put on hold sooner than expected last year with a dramatic policy change on the part of the Fed at the beginning of the year, which was possibly related to President Trump’s messaging, and then fully reversed in the second half of the year after a crisis in a short-term institutional money market (termed “Repo” as it involves overnight bank and corporate borrowing collateralized with securities that are “repurchased” the next day) indicated that the Fed needed to inject liquidity to regain stability in that market. But stability in the Repo market has not been cheap; the Fed increased the money supply dramatically (roughly $400 billion) and unexpectedly over a period of many months to manage the Repo market. The Fed’s uncertain response has left uncertainty in markets about how well the monetary system is working. The Fed’s inability to understand sufficiently the workings of the financial system was famously on display during the Great Financial Crisis. Now the bond market is betting that global central banks are unable to raise rates to their stated policy targets and that inflation will stay below the Fed’s target forever; the market’s inflation expectation is seen in Treasury bond prices reflecting a market consensus that inflation will average 1.6% for the next 30 years! A look back at US inflation in the 1952-1980 period (see chart) indicates that low inflation may continue a long time but not necessarily forever.
The 2019 Long-Term Budget Outlook
The House passed a two-year spending agreement that lifts the government’s borrowing limit and boosts spending by $320 billion above limits set in earlier budget law and suspends the debt ceiling until the end of July 2021. The Congressional Budget Office now projects that 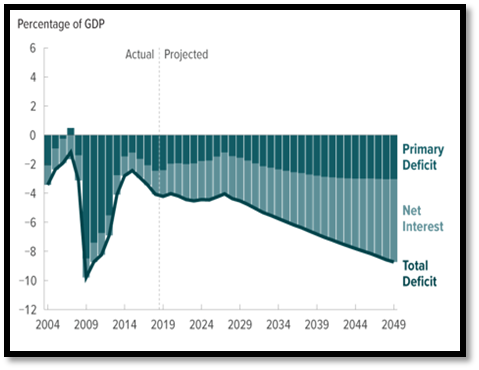 the national debt and annual federal budget deficits will hit the highest levels since World War II over the next decade, as the government will borrow and spend $1 trillion more than it collects in 2020 and deficits will reach or exceed that level every year for the foreseeable future. And at this time, there seems little will among political and economic leaders to limit the further run-up of debt.
The amount of debt forecast would be the highest in the nation’s history by far and policymakers have no clear understanding of the full significance of having such a magnitude of debt. In the near-term, low interest rates provide a fiscal cushion to increased debt, but low interest rates are also enticements to borrow. Recent academic research has shown that nations with lower debt-to-GDP ratios responded to financial crises, on average, with more expansionary fiscal policy than their higher-debt counterparts. Recoveries from the crises were also faster, and the lost economic output was smaller, in the nations with lower debt-to-GDP ratios.
Market and Economic Expectations
Looking forward, here are our core expectations which inform asset allocation positioning for our portfolios:
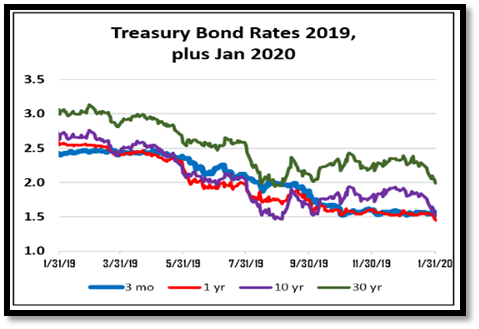
- US and global long-term economic growth will continue at a moderate pace, dampened by ongoing trade tensions and also a recession at some point in the relatively near term. The latest forecast from the IMF cuts slightly its global economic growth for 2020 to 3.3 per cent and reduced the forecast for 2021 to 3.4 per cent. These figures are only a little better than the 2.9 per cent achieved in 2019, the worst year for the global economy since the financial crisis more than a decade ago. The inversion of the US bond yield curve (where 3 month bond rates are higher than 10 year rates, see bond rate chart), a measure investors view as a meaningful predictor of an upcoming recession, occurred in the summer of 2019 and reoccurred in January 2020, again suggesting caution.
- No more than modest firming of inflation in the short-term and for the longer-term a Fed increase in their target inflation rate by 0.5% to 2.5% and with symmetrical periods above as well as below target.
- Within global equities, relatively modest returns with emerging markets as the most attractive on an expected return basis over the next 5-10 years, followed by EAFE (developed Europe, Australasia, and Far East) and then the U.S. market, which continues to appear historically overvalued.
- Within fixed income, relatively modest returns and a generally neutral weighting among domestic, foreign and muni bond markets, with some overweighting to Treasury inflation-protected bonds as a hedge against inflationary surprise (see chart of inflation 1952-1980).
Between equities and fixed income, we are recommending an underweight to equities and in particular US equities, and with a corresponding overweight to fixed income investments.
The SECURE Act – “Setting Every Community Up for Retirement Enhancement”
Major legislation dealing with retirement accounts and taxes passed in December 2019. The law encompasses a wide array of issues and here just a few of the major changes are addressed; at a later time, details can be reviewed in our future communications concerning how the SECURE Act relates to your specific situation.
- The most dramatic change in the SECURE Act is the requirement for non-spouse (and some others – disabled, ill, older, minors) beneficiaries of inherited IRA and other retirement accounts to withdraw all funds within ten years of the IRA account owner’s death; “stretching” distributions out over a beneficiary’s lifetime will no longer be possible. This will affect IRA’s where the owner dies in 2020 or later. This change also will impact living trusts where the trustees are yet alive, but the trust document needs now to be brought into conformity with new law.
- The other two major changes in the SECURE Act are that it lifts restrictions on making contributions to traditional IRA accounts after age 70.5 and that it increases the start date of IRA required minimum distributions to age 72 (for those 70.5 in 2020 and beyond).
- Other changes involve the medical expense deduction limitation (back to 7.5% of AGI) and college savings section 529 plans.