During the first half of 2017, equity markets around the world continued to post strong gains while returns to fixedincome investments were respectable. In sum:
- US stocks rose 9.3%.
- Foreign stocks gained 14.8%.
- Emerging market stocks posted gains of 14.6%.
- Global stocks, in total, gained 11.4%.
- Large cap stocks beat small cap stocks by 3%.
- Growth stocks led value by 9%.
- Investment grade bonds returned 2.3%.
- Inflation was at 1.3%.
GFM client portfolio returns were generally in line with overall markets and strategies in accordance with client portfolio asset allocation specifications. Your accompanying report provides details.
In this letter, we will focus on three issues – economic conditions today, expected future investment returns, and the new financial deregulatory policies of the Trump Administration.
Today’s Economic Conditions
US economic growth in the first half of 2017 continued at a modest pace. The Commerce Department reported that the economy grew at a rate of just under 2 percent for the first half of the year. More of the same for the coming years is the predominant professional forecast. The Trump Administration is planning for 3% growth. Other economic indicators, such as the stock market, unemployment, wages, home prices and corporate profits, all seem to indicate steady economic progress. Inflation is low and stable. The US economy is now in one of its longest expansions ever.
While the economy seems to be in a sweet spot, there is risk of investor complacency during such periods. Indeed, the options market is signaling very low risk aversion. And there is no obvious reason the stock market is hitting such relative valuation heights, let alone index record closes, now with such frequency. Many reasons have been advanced, but uncertainty reigns. It may be the market still expects great things from the new political order in Washington, such as tax reform, deregulation, a repeal of Obamacare, and a major spending package. Meanwhile, quantitative easing (the Fed expanding the money supply) and historically low interest rates could be inflating the value of the stock market. Or, possibly it is part momentum fueled by overconfidence reflecting a stock market that during the past eight years has more than tripled in value and has seen average annual returns of 18%, notwithstanding that the market declined 50% in value during the 2007-2009 Financial Crisis.
Meeting this June, the Fed raised its benchmark interest rate for the third time recently to a range of 1 percent to 1.25 percent. The Fed also described its plans for reducing its bond holdings, which may begin later this year, and expectations for gradual interest rate increases totaling about 2% over the next 2-3 years. These Fed policies likely would incrementally dampen investor enthusiasm for stocks and bonds.
Future Investment Returns
While investment returns have been generous of late, and particularly since the end of the financial crisis and the Fed flooding the economy with cash, what should we expect going forward? For present purposes, let’s just focus generically on bonds and stocks.
On the high-grade bond side of the investment world today, an asset class that is a staple of portfolios, yields as far out as 30 years top-out in the 3% range. This is historically very low; the norm has been about 6%. It is anticipated that rates will be “normalized” over the next few years, but the new normal interest rates will be lower than before. The normalization of rates will depress the prices of existing bonds to varying degrees.
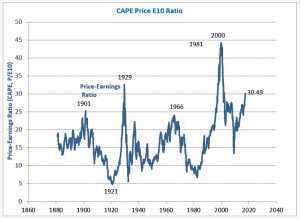
Stocks trade differently than bonds and expected returns are much more difficult to estimate. Let’s look at one of the most respected stock valuation indicators, the Shiller CAPE ratio, to see what it implies. The CAPE (cyclically adjusted price-earnings) ratio is calculated by dividing the current US stock market value by the inflation-adjusted 10-year average of the stock market’s earnings. Think of the CAPE as being analogous to an interest rate for stocks which is inverted, so a lower value means buying more cheaply expected future stock earnings.
The first chart, titled CAPE Price E10 Ratio, shows the current CAPE value for the US large cap stock market at 30.49. That is about twice the CAPE historic average value and implies that stock rates-of-return going forward (because the current prices are so relatively high) will be much lower than historic average returns. Previously, only the years around 1929 and 2000 saw such elevated CAPE values; severe market crashes followed both those eras, but not immediately. For example, the CAPE continued to increase another 3 years from 1997 until, when in 2000 the market crashed, the CAPE reached the peak of 44. The market had gained another 64% in value during that period.
Today, of note, we do not see relatively inflated CAPE valuations in foreign stocks, which seem to be priced normally.
An elevated CAPE ratio such as we currently are experiencing does not definitively indicate anything specific about the future; stock markets are too uncertain for such precision. But CAPE values do seem to be meaningfully and inversely correlated with future market returns. Here, we can explore what the current CAPE ratio may suggest about the future by looking at real examples from the recent past.
To illustrate a relationship of CAPE to future stock market returns, two charts are shown which compare stock market returns and CAPE over two rolling time periods, 20 years, and 17 years. These rolling time periods are used because they permit the inclusion of CAPE values as high as they are today (1997) and the historic peak of CAPE (2000); therefore, we can examine actual cases of very long-term stock market returns that followed periods beginning with CAPE values comparable to today.
The two lines in the graphs, showing stock market returns and CAPE values, use different axes:
- The horizontal axis
- Dates correspond to the value at the end of the rolling time-period for the stock market average annual return.
- Dates correspond to the value at the beginning of the rolling time-period for CAPE.
- The vertical axes
- On the left, scale shows values for the stock market average annual return.
- On the right, scale shows values for CAPE. Note the CAPE axis is inverted, which is done to better illustrate visually the relationship between the two line.
The second chart shows rolling 20-year average annual returns for stocks in comparison to the value of CAPE at the beginning of each 20-year period. The correlation of the two lines is very high; that suggests that future long-term stock market investment returns (solid line) may be highly sensitive to (or otherwise connected to) the initial value of CAPE (dotted line). For example, about 20 years ago in 1997 the CAPE was, as today, at about 30. What did the market return over the next 20-year period? The average yearly return for over 20 years (1997-July 2017) was about 6.5%, which is about 4.5% annually less than “average” historic stock market returns (about 11%).
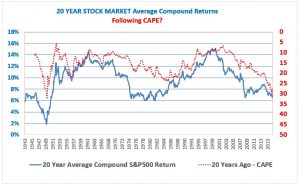
It is instructive also to look at the chart data corresponding to the beginning of the 1997-2017 period from a more intuitive perspective. At the start of the period, an investor looking at the then previous 20-year returns in the stock market saw an average annual return of about 14%! And many investors then assumed the long-term future returns would be similar. If a retirement plan, or a pension plan, had been built assuming a continuation of such stock market returns, the difference between the 14% target and the actual 6.5% could have seriously derailed the plan. For example, over 20 years $100,000 invested at 14% earns $1,274,000, at 11% earns $806,000, but at 6.5% earns only $252,000.
The third chart shows rolling 17-year average annual returns for stocks in comparison to the value of CAPE at the beginning of each 17-year period. This chart therefore ends in July 2017 with the period that began with the year 2000, the year of the stock market crash. The correlation of the two lines again is very high. In this example, in the year 2000 the CAPE was at about 44 just as the market peaked. What did the market return over the next 17-year period? The average was about 4.9%, which is less than half of normal stock market returns. By comparison, investment grade bonds returned 5.2% – more than stocks! – annually during that same 17-year period. Stock market average annual returns spanning a 17-year period that low occurred only one other time, the period following the 1929 stock market crash.
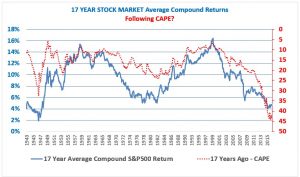
Essential point: The CAPE ratio suggests that buying US stocks at today’s prices, reflecting a CAPE of 30, should be accompanied by realistic expectations of lower than normal returns for a substantial period.
Fiduciary Rule
The new Department of Labor regulation referred to as the fiduciary rule, put in place by the Obama administration, took effect June 9, 2017. The fiduciary rule, an historic (albeit limited) step forward for investors, generally requires financial service providers (such as investment advisors, stock-brokers, and insurance agents) working with retirement accounts to serve as fiduciaries. (Grossman Financial Management serves clients in a fiduciary capacity at all times, and always has.)
But post-Financial Crisis regulatory measures designed to protect investors now face fierce pushback from the financial services industry and its allies in the Administration and Congress. The brief yet too colorful role of Anthony Scaramucci (for details related to the fiduciary standard, see my previous letter), is indicative of the Administration’s intent. The Administration and Congress have already begun a variety of financial protection regulatory roll-back initiatives in such areas as Dodd-Frank financial stability regulations, the Volcker Rule on separating securities trading from banking, the fiduciary standard, the Consumer Financial Protection Bureau (CFPB), mandatory arbitration clauses in contracts, and waivers of rights to participate in class action suits.
Essential point: Expect the Administration to continue to vigorously challenge investor protections and advance corporate interests in the financial services industry.
Looking Ahead
The current economic landscape suggests that investors should continue to expect more modest returns than usual and remain defensively positioned. Our reading of the latest economic and, moreover, political indicators suggests increasing risks ahead.
Essential point: We continue to recommend that investment portfolios lower normal allocations to stocks, emphasize high quality securities (both stocks and bonds), and include meaningful inflation hedges.