Pandemiconomics – The New Abnormal
The year 2020 will be a sad one for the history books. Nothing seems normal anymore, every aspect of human life is impacted by the Covid-19 pandemic, and we are yet in the early days of an uncertain journey. The pandemic has triggered multiple crises – first the illness and then the health care system, the economy and politics. At this moment, the pandemic is out of control in the US, tens of millions of Americans are out of work, the economy is in great distress, and political malfunction has caused unemployment benefits to expire last week for tens of millions of the unemployed.
The facts and news flow about the crises have been truly overwhelming and often confusing. Real data limitations during this fast moving crisis are partially the problem while efforts to discredit unwelcome news have compounded the public’s confusion. Here is a review of where we have been and where the journey may be heading for investors.
Existential Threat – Covid-19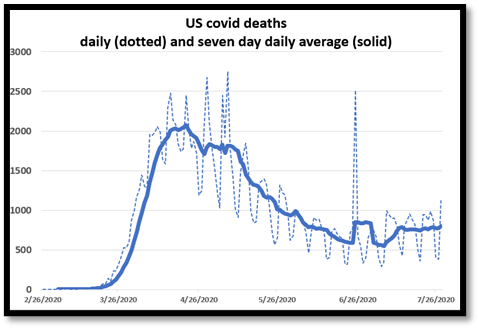
Today and for the foreseeable future, economics is all about the pandemic, hence the malapropism “Pandemiconomics”. This is
because the handling of the pandemic crisis will determine the fate of the economy as well.
The Covid pandemic emerged in latter part of 2019 in China and then in full force in early 2020 around the world. The response to the pandemic threat, following standard epidemiological practice, has required protective behavior such as “social distancing”, wearing masks and frequent hand washing. Nations around the world have responded in various ways, involving among other things limitations on people gathering to socialize, work, study and more. These health policies have resulted in vast segments of the economy being closed, or at least limited, which in turn has led to an enormous economic crisis that parallels the health crisis. To date, the public health responses in the US have failed to curb the spread of the infection and death, while many other countries have done much better. After earlier restrictions on social intercourse were relaxed, US infection case counts and deaths are again mounting (see chart titled “US Covid deaths”). Given the failure of current social behavior and public policies to stem the spread of Covid, there is no obvious end to the pandemic or to “pandemiconomics” before the development and effective use of a vaccine and/or treatment. At this time, neither the arrival date of a vaccine nor a treatment can be predicted.
Unemployment – Official Figures Obscure Reality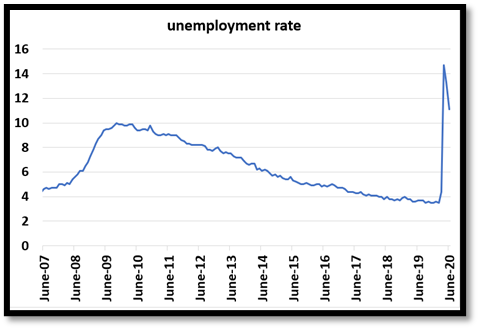
One year ago the total national number of unemployment insurance recepients was 1.7 million while the official count of unemployed was about 6 million. Since mid-April, over 50 million Americans, roughly 1 in 3 workers, have applied for unemployment insurance benefits. At this time, roughly 35 million workers are receiving benefits while the official count of unemployed is about 18 million. The differences between the 50 million applicants, the 35 million on claim and the official count of 18 million are difficult to explain. A relatively small number of recent applicants have been declined and the number of recent duplicative applications is also relatively small. Available data, such as from California, show that millions of applicants, possibly 10%-15% of the total, are still waiting for their unemployment benefits to begin while state unemployment offices deal with backlogs.
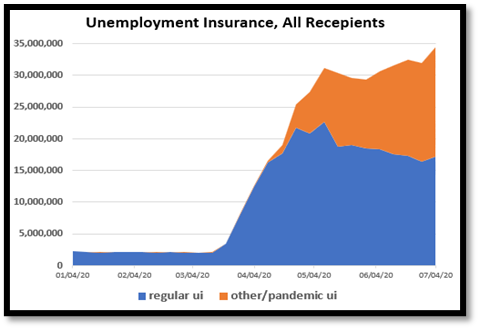 It is noteworthy, and misleading, that the “official” unemployment rate shows about 11% unemployed and that figure dominates public discourse. In reality, a much more accurate number is north of 22%. As shown in the chart titled “Unemployment Insurance, All Recepients”, the “other/pandemic UI” beneficiaries roughly equal the number of “regular UI” beneficiaries. The difference between the two numbers is the result of definitions; the official unemployment number only counts “insured” beneficiaries while the “all recepients” number also includes beneficiaries through the emergency Pandemic Unemployment Assistance program. The current level of unemployment is at least twice the peak rate experienced during the Great Financial Crisis of 2007-2009. And it is not at all clear that the worst is over as the health crisis is now worsening.
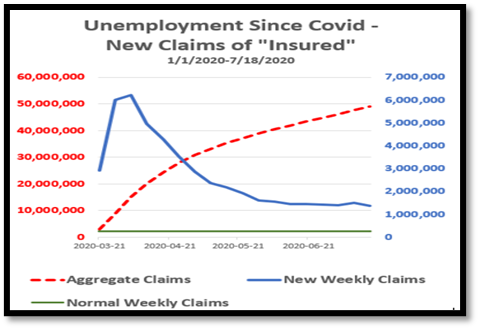 The chart titled “Unemployment Since Covid” shows the number of aggregate claims (in red, left axis) since the onset of the crisis, the number of new weekly claims (in blue, right axis) and the normal level of claims each week (in green, right axis). The decline in new applicants (blue line) from the staggering 6 million peak in early April has stalled and new applications seem to have leveled off, and may possibly be rising again, at about 1.5 million applicants each week. The normal level of applicants (green line) is about 250,000. These numbers represent economic depression-like devastation for tens of millions of Americans that will not be easily repaired.
Investment Markets Performance
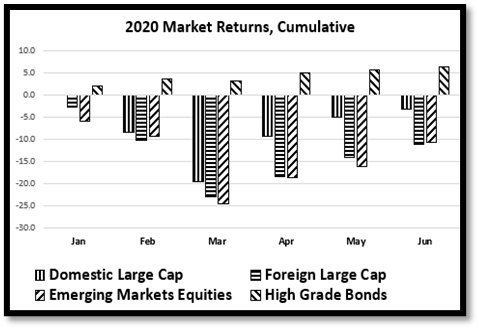 In the shadow of Covid, equity and bond markets around the world during the first half of 2020 registered extremely volatile behavior and returns (see chart titled “2020 Market Returns, Cumulative”).
- US stocks declined -3.1%.
- Foreign stocks declined -11.3%.
- Emerging market stocks declined -10.3%.
- Investment grade bonds gained +6.1%.
That US stocks declined “only” 3.1% during the first half of the year understates enormously what happened on a daily basis. Between January 1 and February 19, the market rose 4%. Then, as the meaning of the pandemic became increasingly clear, the stock market dropped 34% by March 23 (see chart “S&P 500).
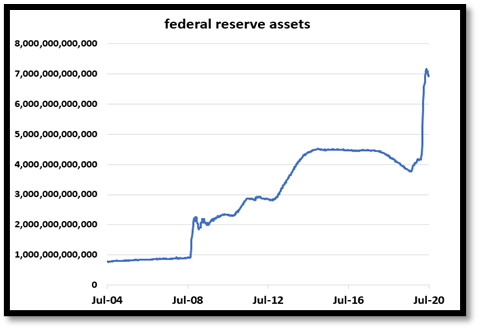
The dramatic declines in the stock market i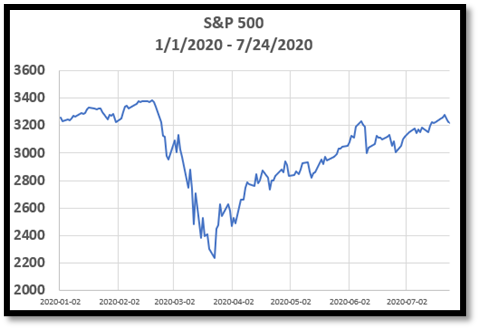 nvolved vast selling of stocks and demand for safe havens for the cash proceeds, which in turn created stresses on the entire financial system that were responded to with historic policy moves by the Federal Reserve to safeguard the financial system and avoid broader damage to the economy. The Fed response entailed the creation of about $3 trillion to provide cash and liquidity to markets (see chart titled “Federal Reserve Assets”). The Fed’s expansion of the money supply was dramatically faster than its actions during the Great Financial Crisis starting in 2008 when it also created about $3 trillion of new money, though it did so over about six years rather than three months this time. In sum, the money supply has increased 7-fold since 2007 and the implications are far from clear.
 The returns in the US stock market during the first half of 2020 also were incredibly skewed; the Tech Star stock prices (Facebook, Google/Alphabet, Netflix, Microsoft, Amazon, Apple) increased in value about 27% on average while all the other stocks in the S&P 500 declined on average almost 11%. The Covid crisis displayed the uniquely valuable services and vitality of the Tech Stars during the pandemic lockdowns as well as their domination of economic activity. Maybe not coincidentally, Congress last week opened hearings to explore whether the Tech Stars are exerting monopoly power to the detriment of consumers, workers, and the economy as a whole.
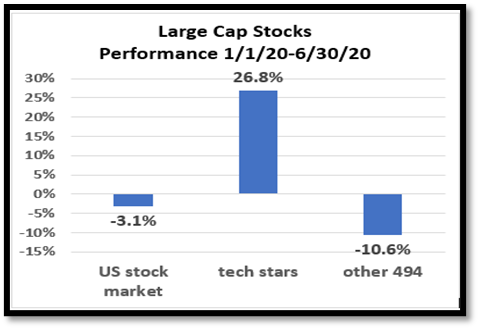
The Fed actions intentionally drove interest rates practically to zero (see chart titled “Treasury Bond Rates 2019-2020”). As bond prices move inversely with interest rates, bonds appreciated and ended the year through June 30 up about 6% in value.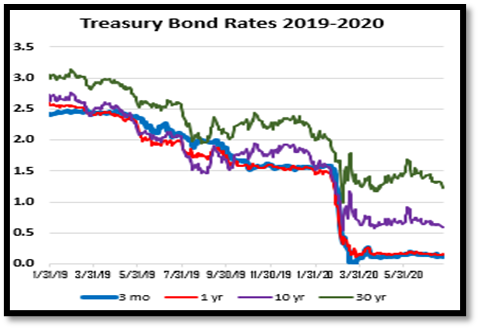
The federal government also took dramatic action by enacting economic support programs worth about $3 trillion that put dollars into the pockets of millions of taxpayers, expanded dramatically unemployment benefits, and supported business in a variety of ways.
The combination of government spending, Fed bond buying pushing rates near zero and sheer optimism lead to a strong reversal in market dynamics. The much lower interest rates were seen as unattractive and investors moved aggressively to buy stocks. By June 30, the stock market had risen 39% from the nadir, a remarkable rebound which exceeded the 34% decline by 5%, but still left the market return down 3% for the period (because the percent decline was from a larger number and the rise was from a smaller number).
The Economy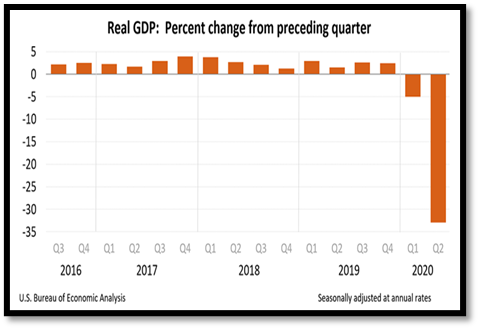
The damage to the economy at this time is difficult to calibrate, though available data indicate that the world and the US are in a deep recession, possibly the greatest since the Great Depression and certainly more damaging than the Great Financial Crisis. The US Bureau of Economic Analysis estimated that GDP declined during the first quarter of 2020 at a 5% annualized rate and that in the second quarter the economy declined at a 33% annualized rate (see chart titled “Real GDP: Percent change from preceding quarter”).
Huge segments of the economy are effectively closed and/or on life-support – airlines, transit systems, hotels, restaurants, public schools, shopping centers, sports arenas, college campuses, theaters and on and on. An estimated one-in-three apartment dwellers have not paid rent for months, though evictions have been temporarily delayed. An estimated 5 million workers have lost health insurance because of job lay-offs. Corporate profits have declined dramatically, including an estimated 42% during the second quarter. Business closures and bankruptcies abound – such as an estimated one-third of small businesses in New York City along with bankruptcies among well-established retail businesses such as J. Crew, Neiman Marcus, JC Penney, GNC, and Brooks Brothers.
The vast majority of professional assessments of the economic impact of Covid (with the exception of the President’s Council of Economic Advisors which announced that it would stop issuing economic forecasts) tell the same story. The Fed and the Congressional Budget Office (CBO) project the GDP to decline in 2020 by 5-6%. The Bank of England reports that the recession there is the worst in 300 years. The International Monetary Fund forecasts a global GDP decline over the next year or so in the 5-10% range. Though the margin of error of these forecasts is obviously extremely large, the thinking behind them is clear – this is not an ordinary recession where we can expect an ordinary recovery which just involves some time, understandable strategies, and relatively minor dislocations. Talk of a wonderful “V”-shaped recovery is wishful thinking. There are just too many known problems and too many unknowns to the downside, starting with a medical solution to Covid. Without a medical solution – be it behavioral, a vaccine or a treatment – humanity will need to reorganize itself and its economy. That will be very expensive in terms of both lost work and operational remediation changes.
 Debt
Debt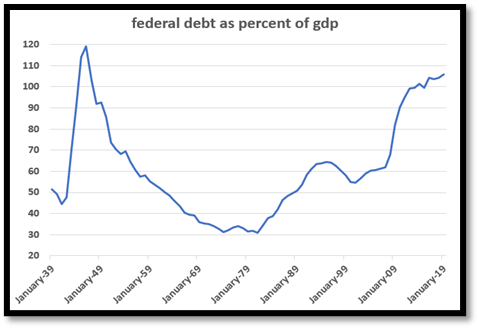
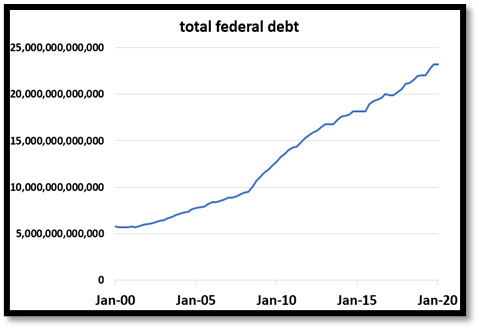
The federal debt, previously a major cause for concern, has risen dramatically this year and the trend seems toward much more debt. Recent estimates have the federal debt around $23 trillion (see chart titled “total federal debt”) while the 2020 budget deficit is expected to hit $6 trillion, up from less than $1 trillion previously forecast. Debt of the current magnitude is unknown previously in absolute terms and in relative terms, as a percent of GDP, such debt has been experienced in the US only during wartime (see chart titled “federal debt as percent of gdp”). As debt increases so does the cost of carrying the debt (assuming interest rates are stable or rise) and that threatens the nation’s ability to have financial resources to continue customary spending. In recent years, the decline in interest rates lessened the carrying costs of the debt meaningfully, but that trend is over. The future trend for interest rates cannot be meaningfully lower and likely will be meaningfully higher.
For many years, the CBO has warned about this issue, that excessive debt to pay for previous spending threatens the nation’s ability to fund all programs in the future. But now the challenge is much worse. To address the debt issue the basic policy choices are just three, and all are unattractive and need to be done on a large scale – increased taxes, lower spending and/or greater inflation to reduce spending costs in “real” inflation-adjusted dollars. The challenge also is underlined by the fact that the US economic growth has been relatively slow since the Great Financial Crisis, which makes debt servicing more difficult than in earlier eras when growth was higher (see chart titled “US gdp growth”). Not surprisingly, the bond credit rating agency Fitch just downgraded its outlook on US debt, saying “The outlook has been revised to negative to reflect the ongoing deterioration in the U.S. public finances and the absence of a credible fiscal consolidation plan”.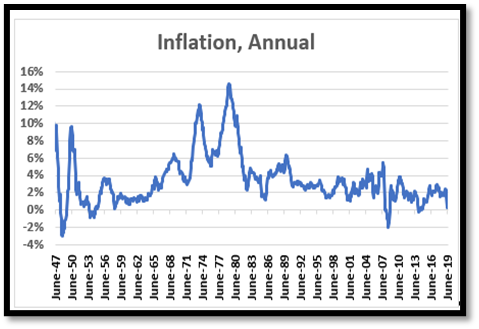
The likelihood of increased inflation is now greater than it has been in many years or even decades. With the federal deficit increasingly out of control, increased inflation could provide a useful policy option, as noted above. Inflation has been running well below the Fed’s target of 2% for over a decade (see chart titled “Inflation, Annual”) and now there is an ever increasing chorus of voices favoring higher inflation being heard from leaders at the Fed, economists in academia, and economists in public policy think tanks. A reflection of concern about inflation is seen in the price of gold which has risen over 25% this year, as investors seek a traditional hedge against inflation and a weak currency.
Politics
Looking forward, the most obvious wild card in the deck may be politics, including the November elections in the US. Regardless of political positions, dealing with the Covid crisis will continue to be extremely difficult and the impact on investing will be substantial. At the current moment, negotiations in Washington center on a possible extension of the national relief package passed months ago and which has now expired. The Trump Administration and Republicans in Congress propose to reduce dramatically the economic benefits to the unemployed in order to get workers incentivized to go back to work and to manage the deficit. Democrats in Congress are negotiating for a package which basically extends current relief benefits at the same level and see the deficit issue as secondary. It is anticipated that a package including a substantial reduction of economic relief in aggregate would dampen macroeconomic activity if it did not lead to workers going back to work in large numbers.
If President Trump is re-elected in November, a continuation of current economic policies can be expected, including further tax-cuts and deregulation, policies that are supportive of businesses and their stock values. If Joe Biden is elected and comes to office with a strong majority in both house of Congress to implement his plans, expected economic policy changes would include higher taxes on corporations and the wealthy, increased support for unions, heightened public spending, and an assertive anti-trust policy that would impact both the Tech Stars and potentially a wide range of industries that have seen dramatic economic concentration that limits competition and wages. Biden’s expected policies may be good for the economy as a whole but not necessarily beneficial for investment returns.
Asset Valuations
Asset prices fundamentally reflect the economic value expected to be derived from the assets, such as the dividends that stocks pay and the interest that bonds pay. Those economic values themselves are in turn a reflection of economic activity in the broadest sense whose foundational pillars reflect society’s labor force size, quality of human capital, public health and other government services, tax structure, social stability, legal system, public policy and so on. At the outset of 2020, stocks were relatively expensive as were bonds. As described above, many foundational pillars of the economy have changed in ways that do not appear to favor asset prices in the relatively near term.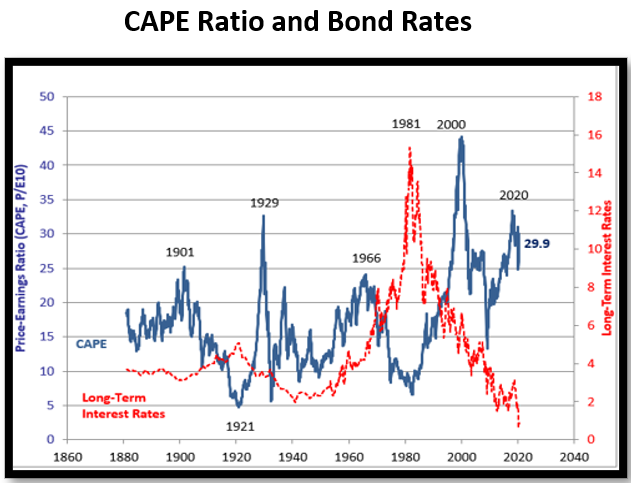
The chart titled “CAPE Ratio and Bond Rates” presents together the “cyclically adjusted price to earnings ratio” (CAPE) and the interest rate on 10-year Treasury bonds. The CAPE ratio is one of the most reliable indicators of future stock market returns; higher CAPE readings correlate strongly with lower future stock returns. Measured by CAPE, stock prices are extremely high relative to earnings, now around 30 times earnings. Today, Treasury bond interest rates are extremely low, now around 0.5%. The blue line is the “cyclically adjusted price-to-earnings ratio”; it is now at a level that has been reached only twice
before, in 1929 and 2000, and which were followed by historically deep stock market declines. The red line is the interest rate on 10-year Treasury bonds, which is now at the lowest point in history. It would defy investment logic and economic history if these extremely abnormal conditions would persist for the long-term, yet they may persist longer than expected.
Stock prices, after declining by about one-third through mid-March, almost rose by June 30 to where they were on January 1 and they then continued to advance to a new all-time in late July. That said, the economy is in a deep recession while corporate earnings have declined dramatically. That stock prices have more than fully rebounded reflects not so much optimism about expected future earnings as pessimism about bonds yields today and wishful thinking about tomorrow.
Stocks today may seem to be relatively attractive when interest rates are about 0.5%. But stocks are long-term investments that depend on returns far into the future and the historically low interest rates today may not provide the same support going forward. If inflation and interest rates rise, then the process will go into reverse. Certainly, interest rates for bonds will not remain pinned to the floor forever by the Fed. In fact, the Fed wants interest rates and inflation to be meaningfully higher, which would threaten price supports for both bonds and stocks. And inflation may come back. The Fed’s policy of printing vast amounts of money and spending it to finance the Federal deficit and to lower bond rates would normally be expected to drive inflation higher. But because higher inflation did not result from a similar though much slower expansion of the Fed’s balance sheet during the Great Financial Crisis, normal expectations about the linkage of money supply and inflation are in doubt and that may be causing a false sense of security among investors and economic policy makers. That said, it is notable that the value of the US dollar, since the Fed’s expansion of the money supply, has declined about 6% in international currency markets and the price of gold has risen to historic highs as investors hedge against potentially higher inflation.
Looking Ahead
Portfolio asset allocation strategy is the dominant factor driving investment returns and in constructing an optimal portfolio in light of investor objectives. At this time, economic uncertainty to the downside appears possibly greater than at any other time since the Great Depression. Over the longer term, rational and reasonable fact-based assessments of investment value lead to relatively attractive returns and risk management. In that sense, successful investing decision-making is similar to public decision-making concerning the Covid crisis. It is always great to be lucky, but meanwhile it is invaluable to plan carefully and objectively. Impatience and emotion are not the investor’s friend. Investors in stocks and bonds should expect much more modest returns for a period of time as the economy passes through the recovery from Covid or to a New Abnormal of living with Covid. The great uncertainly that lies before us underscores the continuing need for a smart, well-diversified portfolio leaning more than usual toward risk management.